Introduction
Only tested code is worth something. With a code coverage report you can see what code is tested and what is not. That is essential to ensure the functionality of the code, also towards customers. In addition, there are also many benefits for you and your team. For example, you have a growing codebase and you want to have easy overview about what code is working and tested and where your team needs to add some tests. Your code quality will improve too. By testing the code, one also deals with its structure. This makes complicated passages with many if conditions stand out and makes it possible to optimize those methods.
Therefore it is important to have an overview of the percentage of tested code.
Because we had trouble finding a good guide on how to do this we decided to write this post to help those who encounter the same problem.
As a reference we used the best guide we found (even if it does not work out of the box):
https://medium.com/@dijin123/angular-unit-testing-code-coverage-report-in-azure-devops-build-pipeline-a062c881609c
To do the same thing with a dotnet backend you can follow this guide:
https://dejanstojanovic.net/aspnet/2020/may/setting-up-code-coverage-reports-in-azure-devops-pipeline/
In this post we want to show you how to add a coverage report to your angular project. In addition, we will also show you how to display the code coverage in the dashboard.
Install Junit-Reporter
Run the following command to install the junit-reporter, which we will use to collect code coverage from our unit tests.
npm install karma-junit-reporter --save-devYou need to add an additional script into your package.json to get ng test to run without waiting for refreshes:
"test-headless": "ng test --watch=false --browsers=ChromeHeadless --reporters=junit --code-coverage"Your package.json file should look like this now:
{
  "name": "angular-testing",
  "version": "0.0.0",
  "scripts": {
    "ng": "ng",
    "start": "ng serve",
    "build": "ng build",
    "watch": "ng build --watch --configuration development",
    "test": "ng test",
    "test-headless": "ng test --watch=false --browsers=ChromeHeadless --reporters=junit --code-coverage"
  },
  "private": true,
  "dependencies": {
    "@angular/animations": "^14.1.0",
    "@angular/common": "^14.1.0",
    "@angular/compiler": "^14.1.0",
    "@angular/core": "^14.1.0",
    "@angular/forms": "^14.1.0",
    "@angular/platform-browser": "^14.1.0",
    "@angular/platform-browser-dynamic": "^14.1.0",
    "@angular/router": "^14.1.0",
    "rxjs": "~7.5.0",
    "tslib": "^2.3.0",
    "zone.js": "~0.11.4"
  },
  "devDependencies": {
    "@angular-devkit/build-angular": "^14.1.1",
    "@angular/cli": "~14.1.1",
    "@angular/compiler-cli": "^14.1.0",
    "@types/jasmine": "~4.0.0",
    "jasmine-core": "~4.2.0",
    "karma": "~6.4.0",
    "karma-chrome-launcher": "~3.1.0",
    "karma-coverage": "~2.2.0",
    "karma-jasmine": "~5.1.0",
    "karma-jasmine-html-reporter": "~2.0.0",
    "karma-junit-reporter": "^2.0.1",
    "typescript": "~4.7.2"
  }
}
Edit the karma.config.js
Next we need to edit the karma.config.js in order to use the junit reporter and to export the code coverage as a cobertura file.
To enable the junit-reporter we add require('karma-junit-reporter') in the plugins array.
To export the results in the cobertura format we add { type: 'cobertura' } to the reporters
array inside the coverageReporter. If you have not changed anything else in this file it should look like this:
karma.conf.js
// Karma configuration file, see link for more information
// https://karma-runner.github.io/1.0/config/configuration-file.html

module.exports = function (config) {
  config.set({
    basePath: '',
    frameworks: ['jasmine', '@angular-devkit/build-angular'],
    plugins: [
      require('karma-jasmine'),
      require('karma-chrome-launcher'),
      require('karma-jasmine-html-reporter'),
      require('karma-coverage'),
      require('@angular-devkit/build-angular/plugins/karma'),
      // --------------> Add the following line <--------------
      require('karma-junit-reporter')
    ],
    client: {
      jasmine: {
        // you can add configuration options for Jasmine here
        // the possible options are listed at https://jasmine.github.io/api/edge/Configuration.html
        // for example, you can disable the random execution with `random: false`
        // or set a specific seed with `seed: 4321`
      },
      clearContext: false // leave Jasmine Spec Runner output visible in browser
    },
    jasmineHtmlReporter: {
      suppressAll: true // removes the duplicated traces
    },
    coverageReporter: {
      dir: require('path').join(__dirname, './coverage/angular-testing'),
      subdir: '.',
      reporters: [
        { type: 'html' },
        { type: 'text-summary' },
        // --------------> Add the following line <--------------
        { type: 'cobertura' }
      ]
    },
    reporters: ['progress', 'kjhtml'],
    port: 9876,
    colors: true,
    logLevel: config.LOG_INFO,
    autoWatch: true,
    browsers: ['Chrome'],
    singleRun: false,
    restartOnFileChange: true
  });
};
Coverage Report Publishment Pipeline
Use this pipeline to publish the test results.
pool:
vmImage: ubuntu-latest
steps:
- task: NodeTool@0
inputs:
versionSpec: '18.7.x'
- task: Npm@1
inputs:
command: 'install'
- task: Npm@1
inputs:
command: 'custom'
customCommand: 'run build'
- task: Npm@1
displayName: Test
inputs:
command: custom
workingDir: ''
verbose: false
# run the command we created in the package.json
customCommand: 'run test-headless'
continueOnError: true
# Publishes test results
- task: PublishTestResults@2
displayName: 'Publish Test Results $(Build.SourcesDirectory)/test_report/TESTS-*.xml'
inputs:
testResultsFiles: '$(Build.SourcesDirectory)/TESTS-*.xml'
# Publishes Coverage from cobertura xml
- task: PublishCodeCoverageResults@1
displayName: 'Publish code coverage from $(Build.SourcesDirectory)/coverage/**/*cobertura-coverage.xml'
inputs:
codeCoverageTool: Cobertura
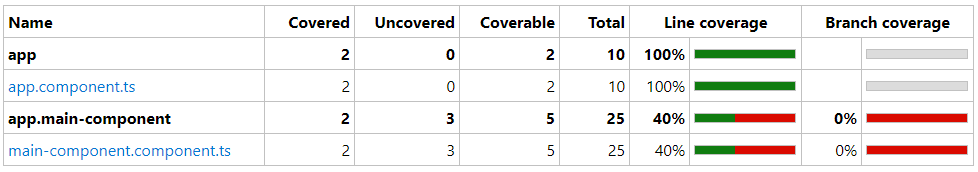
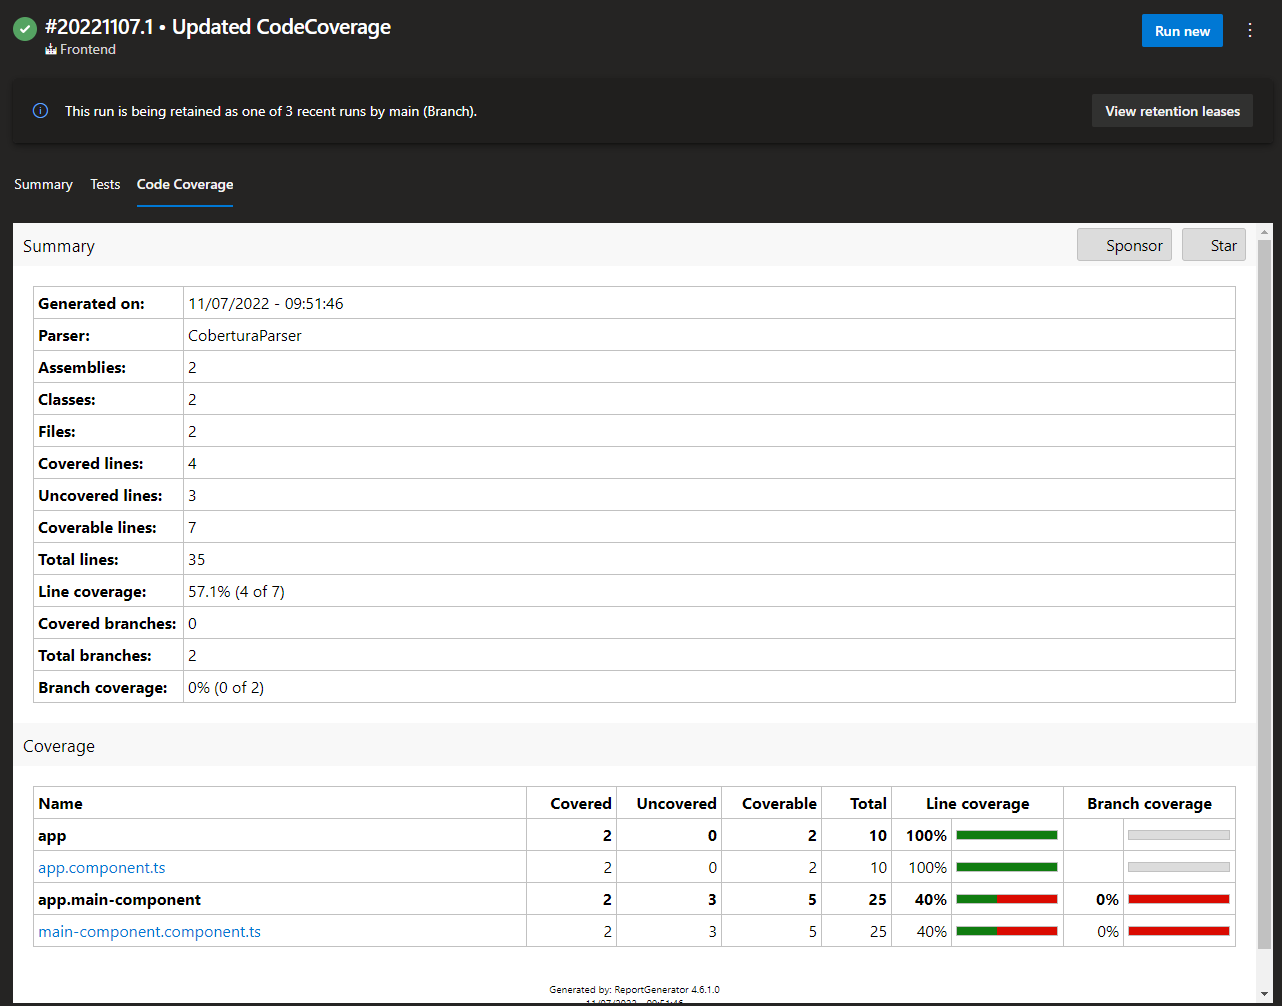
summaryFileLocation: '$(Build.SourcesDirectory)/coverage/**/*cobertura-coverage.xml'After the pipeline ran successfully you can view the code coverage that was published by this run under the tab Code Coverage in the pipeline result window. Here you can see how it should look if you followed all steps correctly:
Add Report to Dashboard
Now we add the Report to our Dashboard.
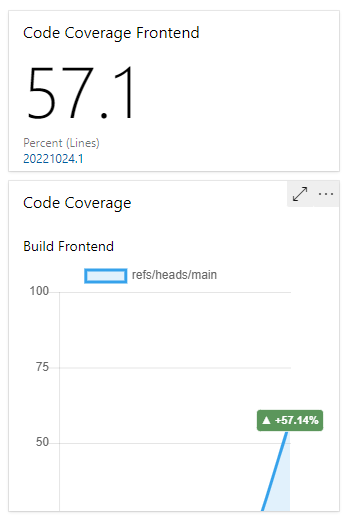
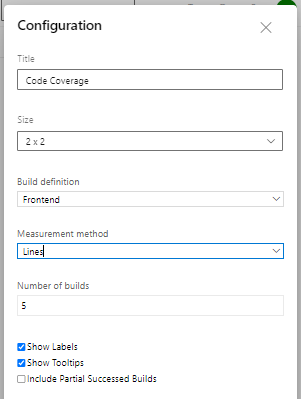
Current Code Coverage widget
Preview:
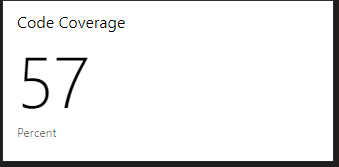
At Azure DevOps Dashboard, click edit of "Add a widget" and search for "code coverage". If you don´t find the widget download it from the marketplace:
https://marketplace.visualstudio.com/items?itemName=shanebdavis.code-coverage-dashboard-widgets
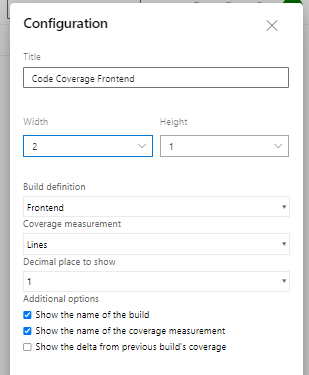
You need this configuration:
Code Coverage over time widget
Preview:
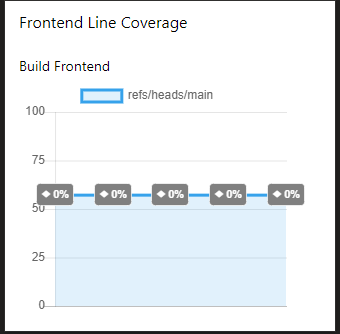
In addition, we want to show the course of the coverage. To do this we search again for "code coverage" in the widget selection and choose the following one:

If you don´t find the widget download it from the marketplace:
https://marketplace.visualstudio.com/items?itemName=davesmits.codecoverageprotector
You need this configuration:
The result shows a good overview of the test status of our code
Conclusion
We believe that coverage reports contribute a lot to every team and give customers confidence in the product.
For example, in our project we decided to add those reports the dashboard and in the process of getting the numbers up, we also learned a lot about testing in general, as we could no longer left complicated parts untested to avoid difficult mocks. We also found a lot of bugs and bad dependencies in our code while testing it. Therefore, for our project in particular the introduction of code Coverage reports helped a lot in terms of code qualtiy.
We hope that in the future significantly more projects will use a coverage report to produce better code and reliable products.
PS
The only thing we think could be improved would be the addition of dark mode support for the dashboard widget, because it would embellish the overall look of the dashboard.
© authored by Gregor Pfister and Nicolas Lerch